Preqin~8 min read
Nobody would staff it, so I made the ask smaller.
An insights feed for institutional investors, built on a backend that couldn’t deliver anything in real time.
- Role: Product management, design, and research
- Timeline: Zero to one
- Team: Cross-functional: a PM, data science, and engineering. Product and design were mine.
- Impact: 90% faster time-to-insight
- Platform: Web
Impact
Time to insight
Weekly active users
Upsell
Read over the two weeks after launch, the same window as the other Preqin work, and still at that level when I left in 2021. The 90% is measured against the weeks investment professionals were spending to surface an insight by hand, and it is an estimate against that manual workflow rather than instrumented task time. Two weeks is also short for a feed, where the question is whether people keep coming back. Still missing: the user base the 20% is 20% of.
The short version
Leadership wanted Preqin’s insight problem fixed and had separately concluded that a project couldn’t do it, so nothing was staffed. The PM agreed. Meanwhile investment professionals were spending weeks assembling findings the platform already held.
That is a specific kind of problem to have. The company already owned the expensive half: models capable of generating hundreds of findings a day. What it didn’t own was any way to deliver them, so subscribers were paying for a data platform and then supplying the labour that turned it into an answer. Value the customer has to assemble themselves is value the renewal conversation never gets credit for.
There was no evidence I could put in front of anyone, because producing it required the staffing nobody would grant. So I stopped trying to win the argument and changed what was being asked for: not a commitment, a question. Inside that framing I designed the insights experience — a templated feed of machine-generated findings ranked by actionability.
One constraint sat behind every design decision. The backend couldn’t deliver in real time and would not before we shipped, which is what made the findings arrive pre-composed rather than computed. Time-to-insight fell 90%, weekly actives 20%, upsell 8%.
What I owned
I owned
- The reframe that got it staffed at all: converting a commitment nobody would make into a bounded question, and scoping that question so either answer was affordable
- Design end to end
- Discovery: 12 interviews with asset managers, and the journey map from them
- The Insights Feed: the template model and the ranking
- Pressure-testing every concept against what the models could actually deliver
Shared
- The delivery model, which the backend’s real-time limits decided as much as I did
- Which findings counted as actionable: the data science side set what was computable, I set what was legible
Problem
Why were people spending weeks answering questions the data already held?
Investment professionals worked through scattered dashboards to assemble a picture the platform could in principle have assembled for them. Decisions came slowly and adoption suffered.
Interviews with 12 asset managers found three things. Volume and noise made insights impossible to prioritize. Contextual metrics sat across separate dashboards, so patterns were only visible to someone already looking for them. And peripheral signals (alerts, comparisons, portfolio anomalies) were ignored almost entirely.
On the other side, the models could generate hundreds of findings a day, and the backend couldn’t deliver any of them in real time.
The half the company already owned
The company already owned the findings. What it didn’t own was any way to hand them over.
This mattered because it changed what kind of project it was. Read as an insight problem, it needs better models, more data science, and a research programme, all of which are expensive and none of which anyone was going to fund. Read as a delivery problem, the models are a given and the work is getting a few hundred findings a day in front of someone in a form they will read.
The second version is much smaller than the first, and it is also the accurate one — the models were already producing more than anyone was consuming. That gap is the whole opportunity, and it is why the eventual ask could be made small enough to say yes to.
Ask for a question, not belief
Could I ask for a question instead of a commitment?
The project was unstaffed because leadership had stated the need but separately concluded it wasn’t viable enough to staff; the PM agreed. There was no advocate on either side of the product and design line, and no evidence to offer because producing it required staffing. The alternatives were a roadmap commitment, dropping it, or a time-boxed experiment with a defined question.
I reframed it as a learning experiment. I was asking for permission to find out whether the belief was correct. I wasn’t asking anyone to commit to the outcome. An experiment without commitment can be under-resourced, and a negative result can kill the idea for years, so the question was narrow enough to answer cheaply either way. It was taken on on those terms; everything below happened inside that framing.
Worth being exact about what moved here: it wasn’t persuasion. No evidence changed anyone’s position, because there was none. What changed was the size of the ask.
One structure for every finding
Could one template make hundreds of findings readable?
Findings could arrive as dynamic real-time visualizations, as a bespoke layout per insight type, or through one template with slots. The backend couldn’t deliver in real time, dynamic visualization was constrained by the same limits, and neither would change before ship.
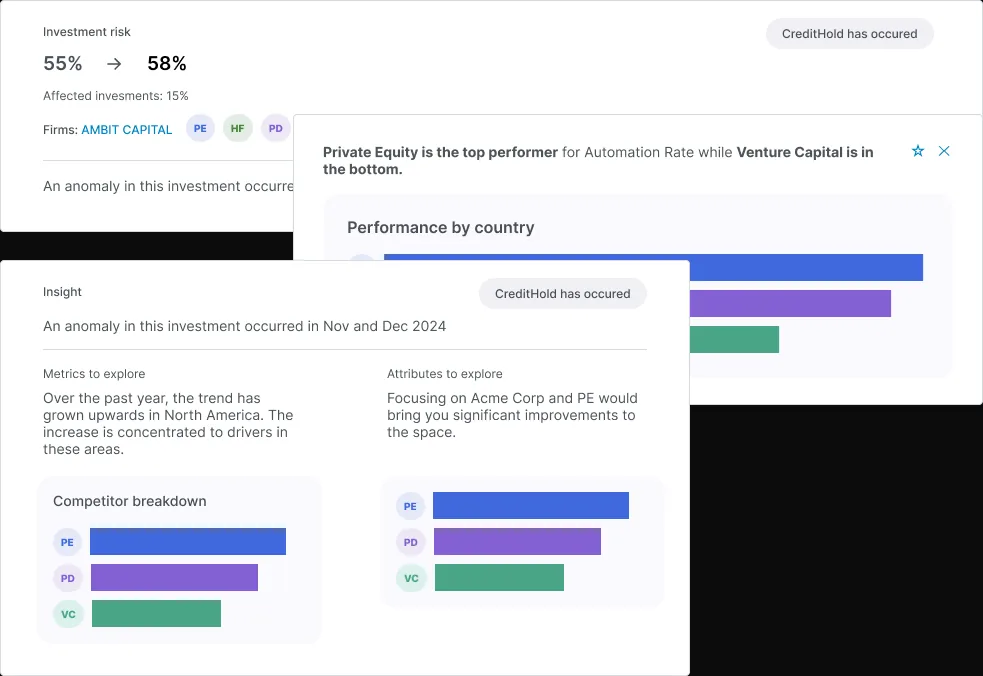
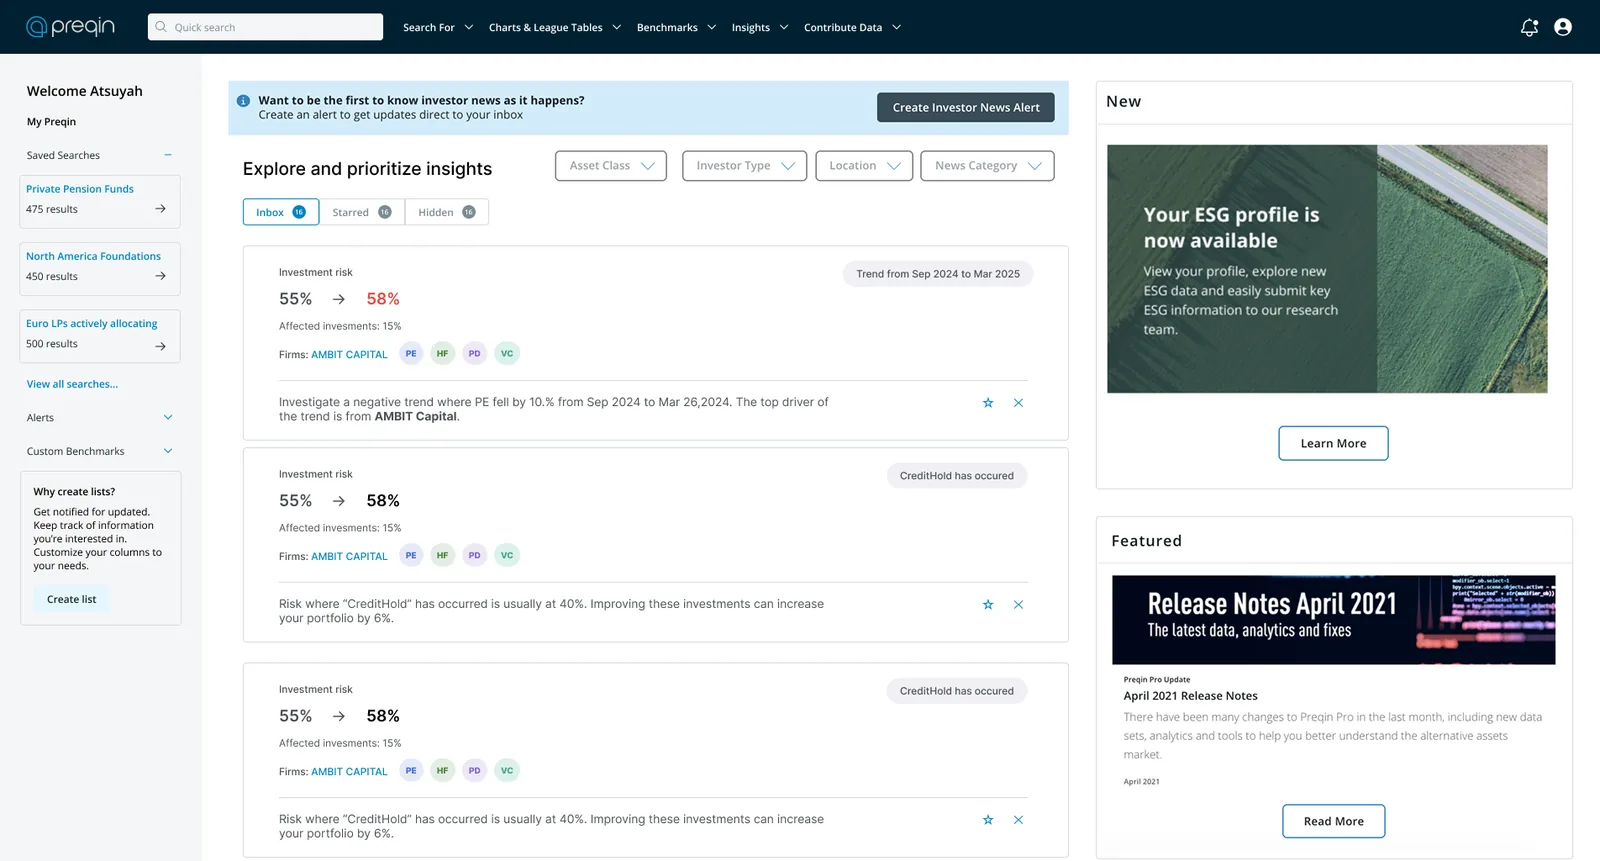
I chose one template with slots. Findings arrive pre-composed and the interface renders them without computing anything. Uniformity makes a feed scannable and ignorable; a templated insight arriving daily can stop registering at the rate a good one does. Ranking countered that risk, because without it the decision would worsen the original problem. Hundreds of findings a day could be delivered and read without anyone learning a new tool.
Let the feed choose what matters
Who should decide what comes first?
A chronological feed, user-configured filters and saved views, or system ranking by actionability were all possible. Volume had made prioritization impossible; chronology would reproduce that problem, while filters require users to know what they are looking for, which research said they didn’t.
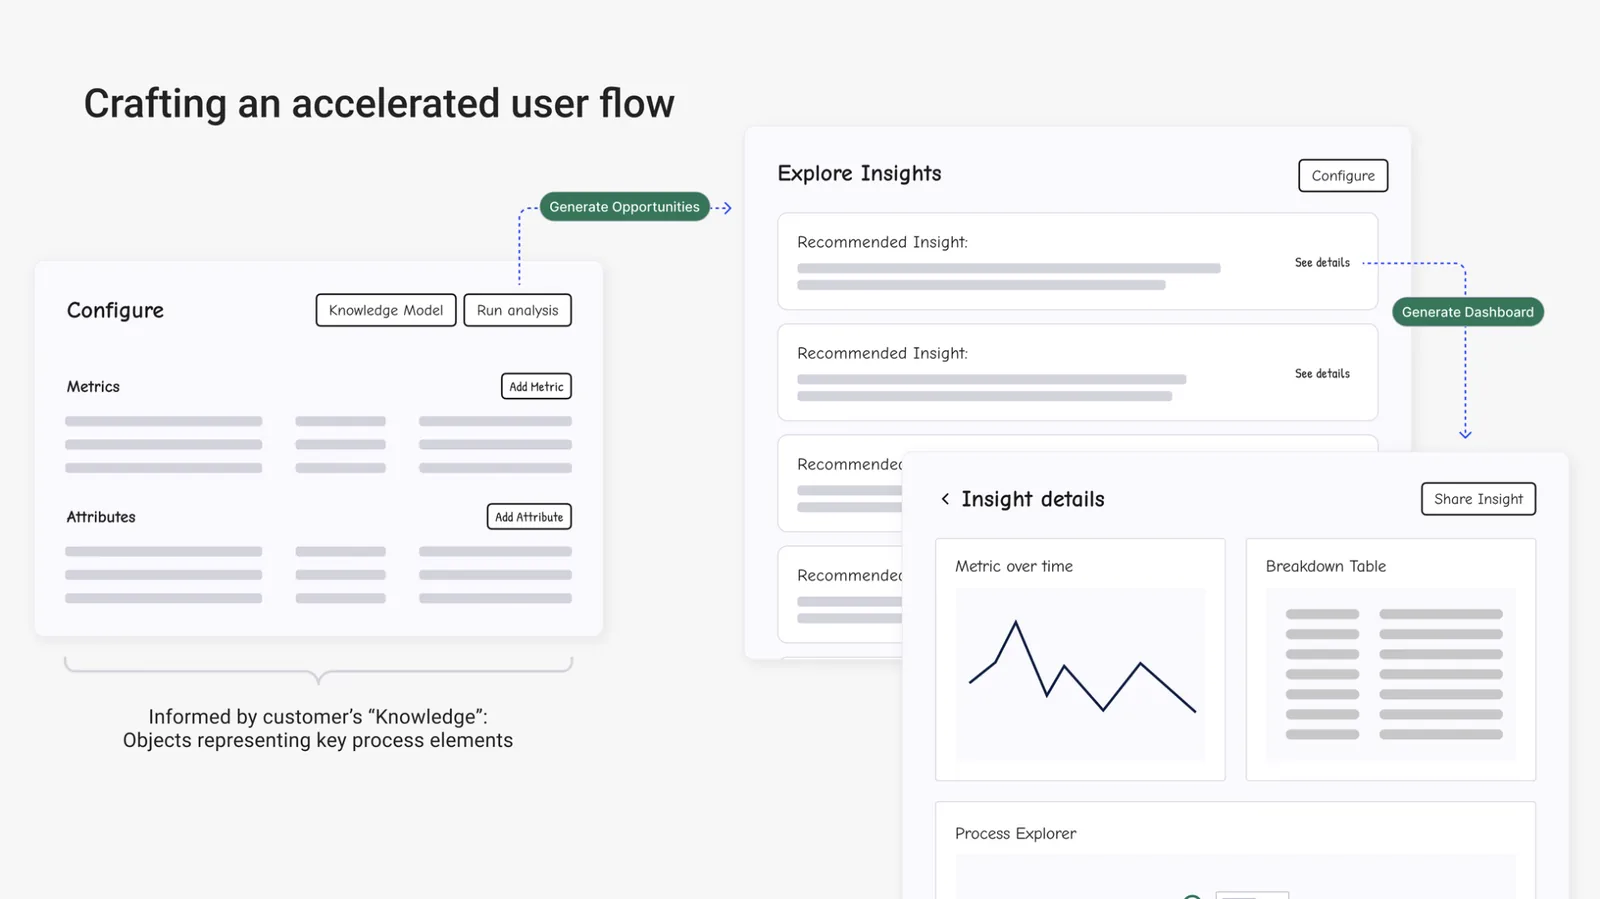
I ranked on the system side and showed the reasoning on the card. Hidden ranking logic wouldn’t be trusted and an untrusted feed would be scrolled past, so each insight unfolds from a single metric into the narrative behind it, making its rank checkable. That directly addressed the research finding that peripheral signals, including alerts and anomalies, were being ignored.
What we shipped
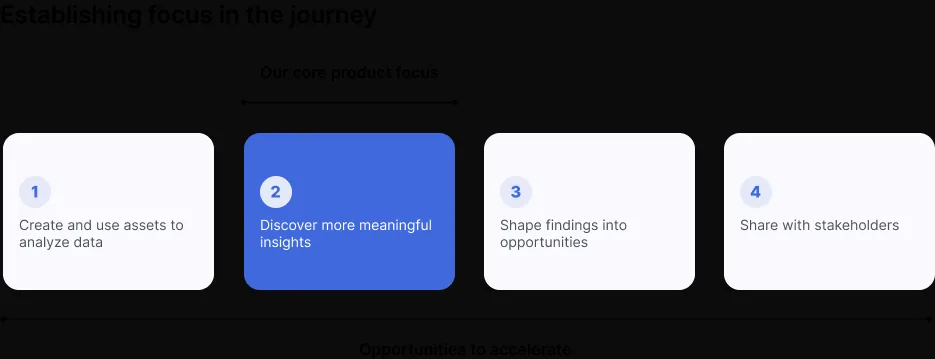
We shipped the Insights Feed: templated findings from the generative models, ranked by actionability, each expanding from a headline metric into the narrative behind it. It fit existing workflows and required no training.
What the template made cheap
The template is the piece with the longest reach. Because findings arrive pre-composed into slots, a new finding type is a data-side change rather than an interface project — the team can ship a kind of insight nobody had thought of without design or front-end work, and without anyone learning a new tool. That converts the roadmap from a series of features into a supply question.
Ranking with its reasoning on the card does something similar for trust: a rank a user can check is a rank the team can change. Tuning the model afterwards doesn’t require re-earning the user’s confidence, because the confidence was never in the ranking, it was in being able to see why.
The organisational unlock is the one I’d point at first, though. A thing leadership had concluded was not viable shipped and produced numbers, which changes what can be asked for next in a way no individual feature does.
With nothing to put in front of anyone
With no evidence and no advocate, the move is to shrink the ask, not to strengthen the argument.
Leadership had already reached a conclusion, the PM agreed with it, and the evidence that would have changed either mind could only be produced by the staffing being refused. Every additional hour spent building a case would have been spent on a case with nothing in it.
What I do differently since: when I can’t change what someone believes, I look at what I’m asking them to agree to. A commitment needs belief. A bounded question only needs to be worth answering, and that is a much lower bar for someone to clear — which is why the ask got taken up on terms nobody had to defend.
It is not a general-purpose move and it has a specific failure mode I was lucky to avoid. An experiment nobody committed to can be under-resourced into a false negative, and a negative result on an idea like this can bury it for years. It only works where the question is genuinely cheap to answer either way. If the cheapest honest test is still expensive, shrinking the ask just relocates the problem.
The feed could succeed by being new
Templating may have made the feed easier to ignore as well as easier to read. The same structure that let hundreds of findings arrive without new interface work made them look alike, so ranking had to keep the useful ones from becoming background noise.
The template solved the delivery constraint, and the system ranked by actionability. I left before slow ranking decay could show up, and the recorded timeline doesn’t establish how long the 90% improvement held or whether the feed was still benefiting from novelty. A ranked feed needs evidence that it stays interesting. Evidence that it works at launch is the easy half.