Apartment List~8 min read
A written-off segment got four weeks to prove itself.
SMB and mid-market had no platform, no reporting, and no internal advocate. Enterprise growth stalling is what got them a hearing.
- Role: Product design and research
- Timeline: 4 weeks
- Team: 1 engineer, me (design + product)
- Impact: $50k → $350k revenue
- Platform: Web
What changed
Segment revenue
up from $50k
Reporting adoption
up from 2%
Renewals
up from 20%
Targets I set and reported against, read at three weeks, ahead of the three months Apartment List normally took to report, and still at this level through the rest of my time there, to 2024. Revenue is run-rate rather than cumulative. Still missing: which system produced each figure, and the account counts behind the two percentages.
How the segment got another look
For years, Apartment List treated small and mid-market landlords as noise. Enterprise was where the revenue came from, everyone knew it, and nobody had revisited that assumption lately. Then enterprise growth stalled, and the company needed a second engine in four weeks.
The segment’s numbers justified the write-off: 30% retention, 80% churn, 2% adoption of the reporting. What nobody had asked was what those numbers were measuring. This segment had never been given a platform, a workflow, or reporting of its own, so its performance was a reading on a product that did not exist.
Testing that in four weeks with one engineer meant scoping the MVP so a bad result would still be worth having. Build too little and a flat number reads as proof the segment is worthless, when all it shows is that you under-built. So I cut the full property management system that had been proposed, scoped to the single workflow partners called blocking, and rebuilt reporting around the decisions partners had to make rather than everything the database could show.
Run-rate revenue moved from $50k to $350k, reporting adoption from 2% to 75%, renewals from 20% to 60%. Enterprise was stalling the whole time, and the closing note is about how much of that I can honestly claim.
What I owned
I owned
- The reframe: that the segment’s numbers were measuring a product it had never been given, and the argument that SMB/MM was a growth channel rather than noise
- MVP scope, and the decision to scope it so that a null result would mean absent demand rather than absent coverage
- The build-versus-buy audit, and the case for a lean MVP over the proposed property management system
- Iterative research with 6 subject matter experts and 6 small-business partners, plus Sales, revenue, and Finance stakeholders
- The reporting rebuild
- Product direction after the PM left, including holding the metrics
Shared with the engineer
- What was feasible in four weeks
- The anonymization that made the market view shippable at all
Problem
What if the segment was not low-value? What if we had simply never built anything that treated it as valuable?
Four things were true inside the company, and none was a product problem. We poorly understood the segment’s supply-side drivers. Its core workflows were logged as edge cases. It was formally flagged as low-value. And no internal story challenged any of that.
The result was guesswork on both sides. Partners couldn’t see how their listings performed, and the company couldn’t see what those partners were worth.
Before
Retention
Churn
Reporting adoption
Retention was 30% and churn 80%, and neither is an annual figure: each was read over three weeks, and over different three-week periods, which is why they do not reconcile as complements. They are two separate reads on the same failing segment rather than two views of one number, and exactly when each was taken is not in the record. The picture is what got the segment written off: four in five accounts leaving, and under a third being held.
Every one of those numbers is a reading on a product the segment had never been given.
Two per cent reporting adoption is the clearest case. There was no reporting built for this segment, so the figure describes how many partners used something that barely existed. Churn behaved the same way, measured against workflows the company had logged as edge cases.
So the numbers were correct, and they were answering a different question from the one being asked of them. Not “is this segment valuable” but “is what we built for this segment working”. Nobody had built anything, so only one answer was available. The segment also had no internal advocate, so there was nobody whose job it was to make this argument — and a write-off with no counter-party stops being a decision and becomes a fact about the company.
A null result had to mean demand, not coverage
Could a listing MVP do the job of a property management system?
We could build a full property management system, buy and integrate an existing one, or ship a lean listing MVP. With four weeks and one engineer, an audit of core versus differentiating features put the full system at multiple quarters with heavy technical-dependency risk, so the real choice was between a lean build and not testing the question at all.
I chose the lean MVP, and the scoping rule mattered more than the scope did. This segment had already been written off once, on numbers it could not have beaten. A second bad number would have settled the question for good, and settled it wrongly — and an MVP that under-serves produces exactly that number, indistinguishable from a real null.
So the test had to be built to fail informatively. I put the four weeks into the one workflow partners named as blocking: if they would not use the thing they had said was stopping them, the demand genuinely is not there; if they would, the earlier figures had been about coverage all along. The cost is that a narrow MVP tells you nothing about the workflows it leaves out.
What was left after privacy ruled out the named market view?
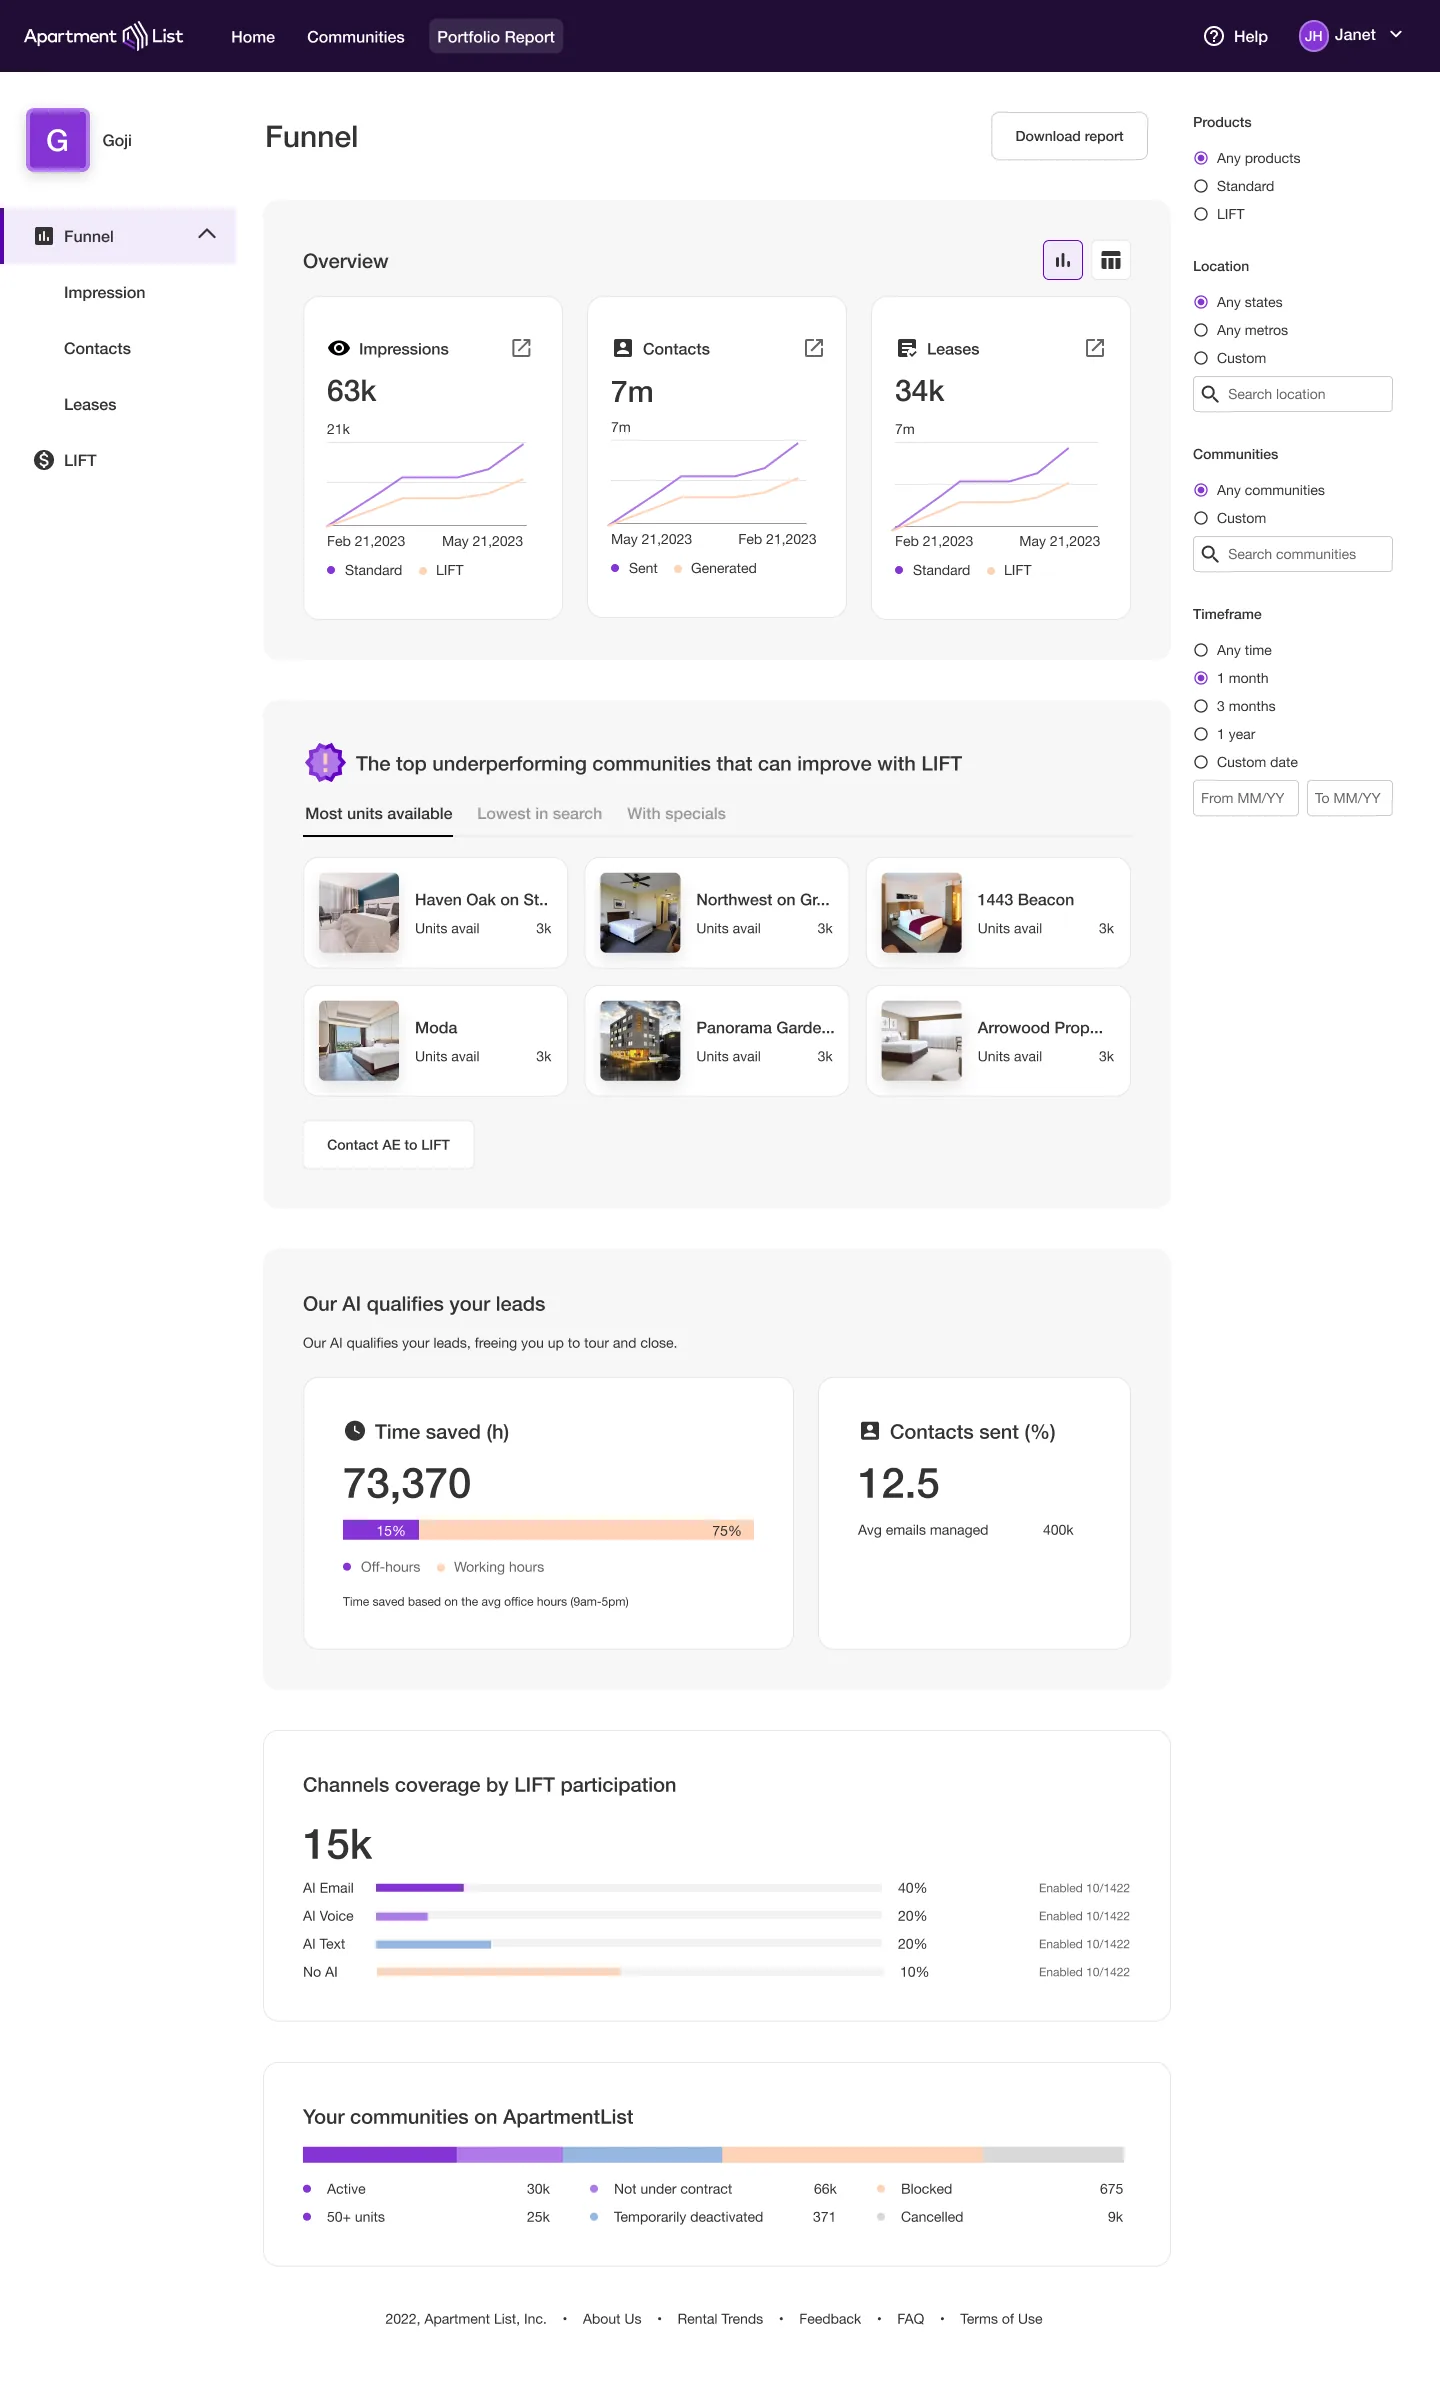
We could show named competitive performance, anonymized market benchmarks, or no market view. The first version exposed identifiable information about partners, carried real performance cost, and exposed personal data they had no right to see; shipping it would trade a segment problem for a legal one.
I anonymized the view and accepted the weaker feature. Anonymized benchmarks are a commodity, while the named version was why a partner might have opened the tool weekly. Nothing recovered that difference.
Why not let partners configure the dashboard?
A configurable dashboard, metric-per-chart reporting, and four fixed views answering named questions all had support inside the team. The PM left mid-project and teams disagreed about which metrics mattered; configurability would defer that disagreement into the product instead of settling it.
I built four views: trend clarity, comparative performance, actionable recommendations, and retention-risk signals. Fixed views are wrong for anyone whose question is absent, and no PM remained to arbitrate the list, so the four came from the twelve research participants rather than from internal preference. The first iteration was rejected as costly to implement and hard to understand; the second shipped.
After the reclassification
Three things were different afterwards, with the caveat below attached to all of them. The segment stopped being classified as low-value, which is an organisational change rather than a product one and probably the more durable of the two — a classification is what decides whether anything gets staffed next year.
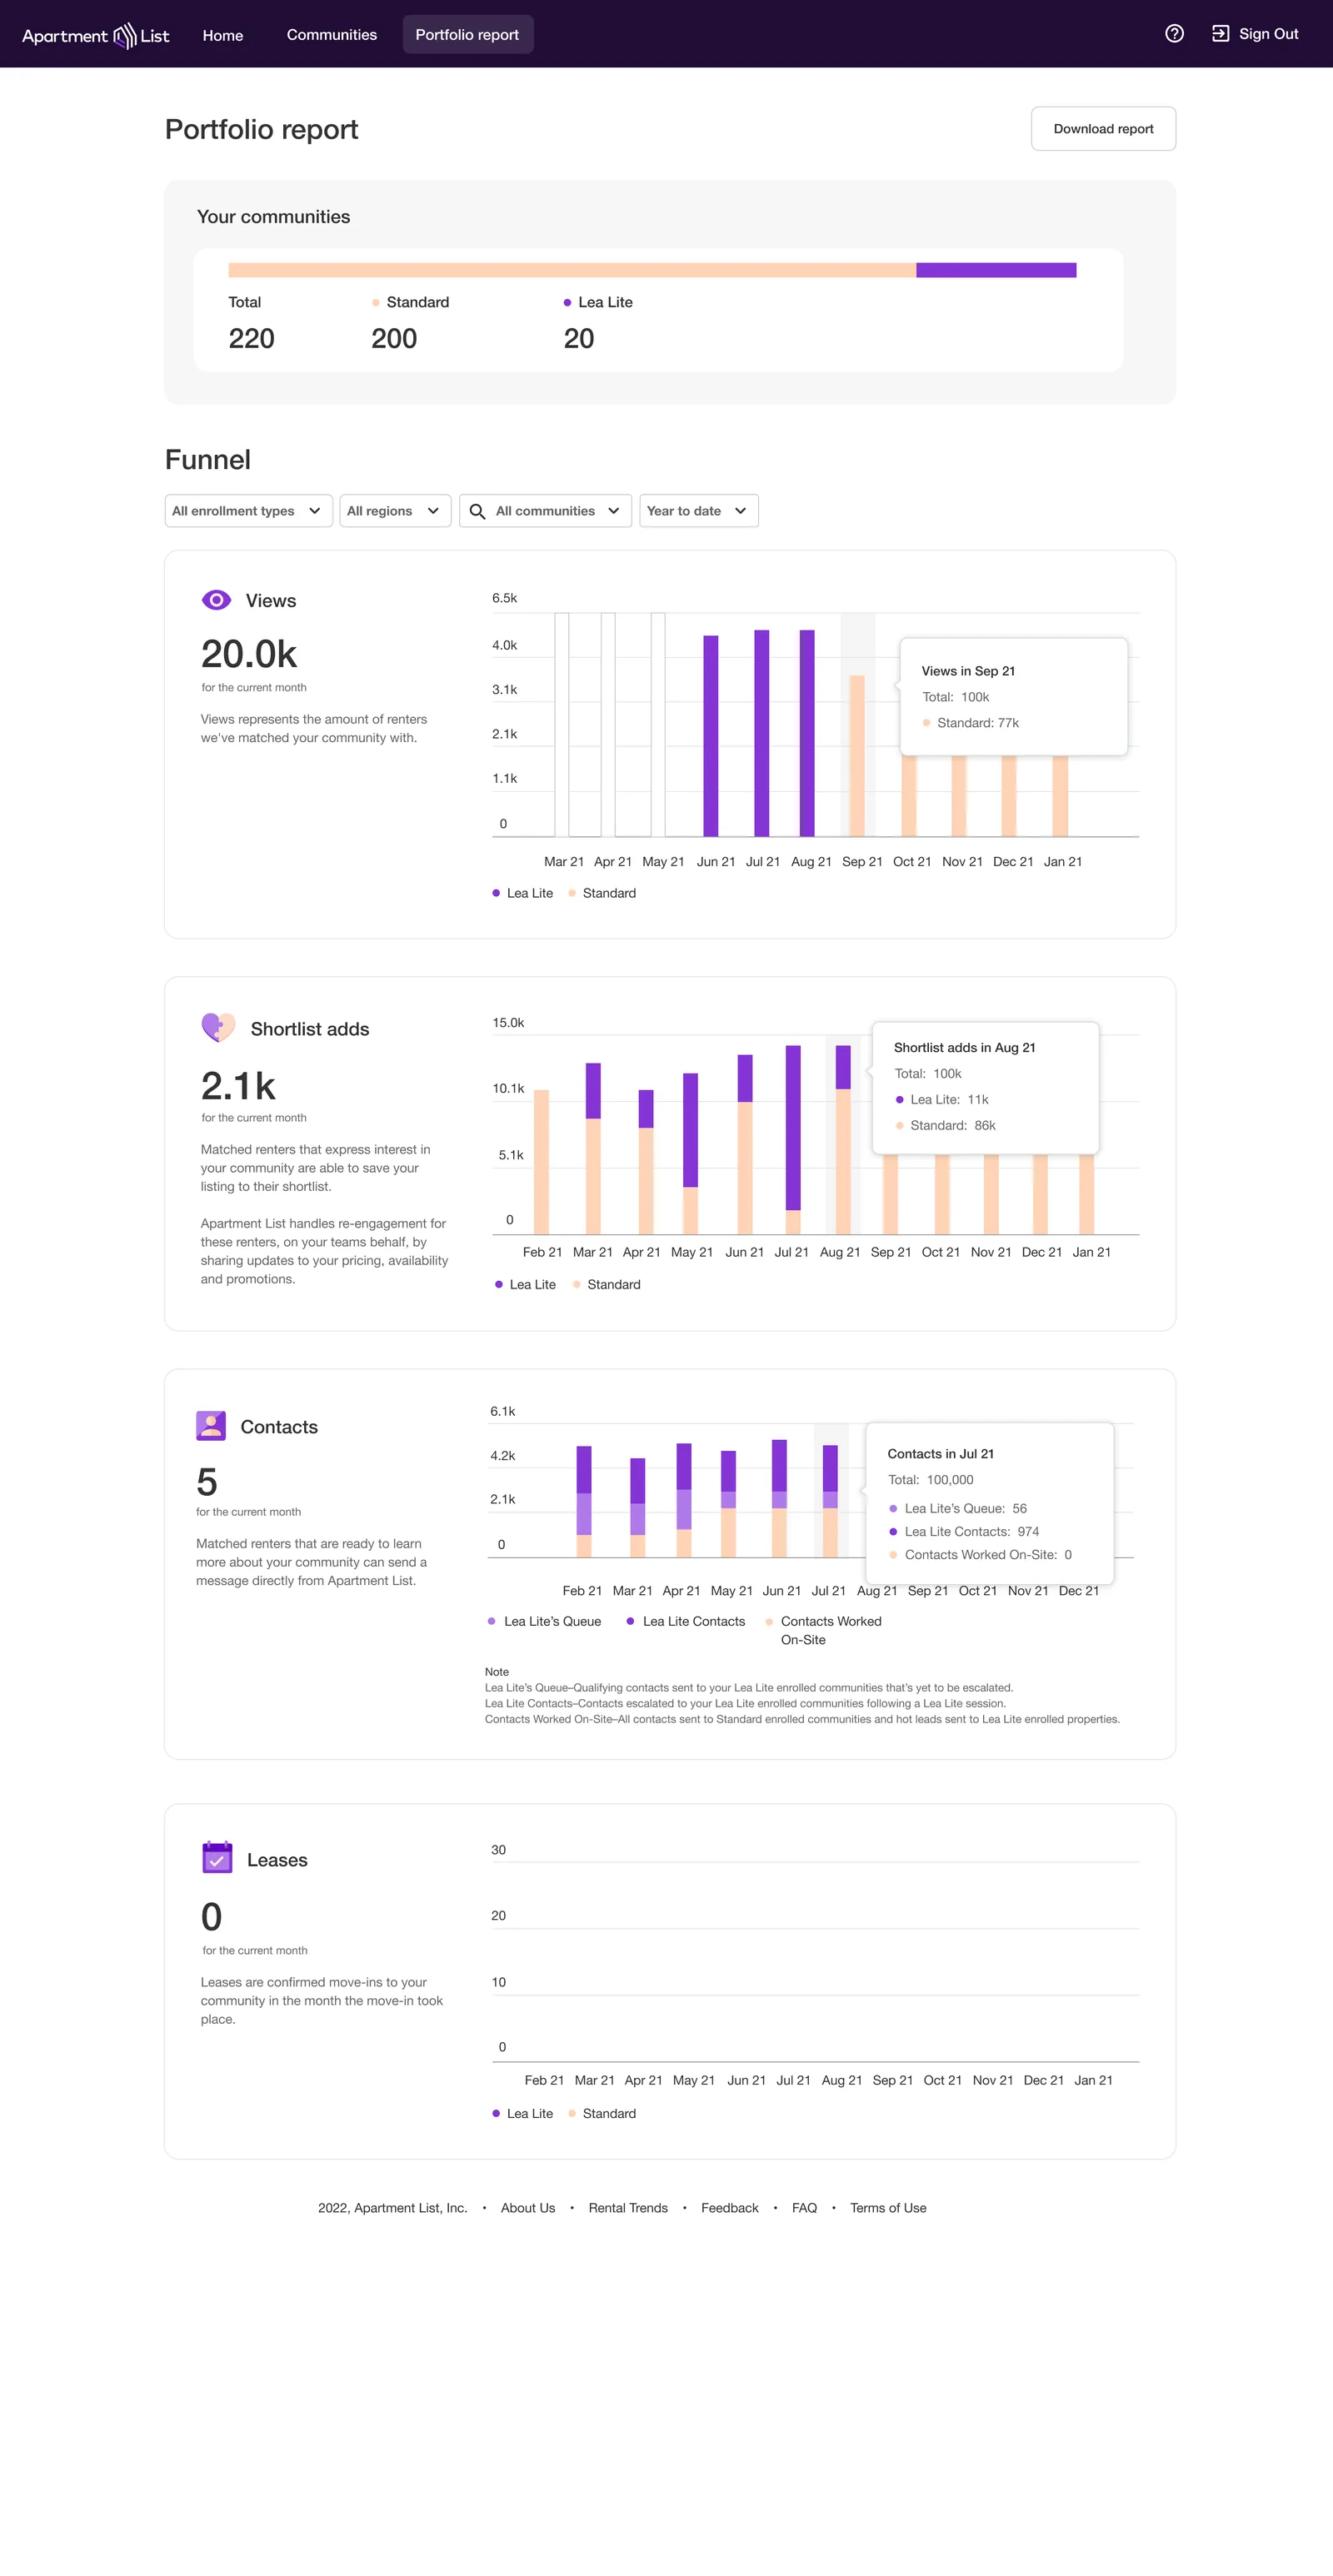
Reporting went from a surface almost nobody opened to one three-quarters of accounts used, which made it load-bearing: a view that gets opened can carry a recommendation, and a recommendation is how a reporting tool moves revenue instead of describing it.
And renewals tripled. That is the figure I put the most weight on, because it is the one least helped by Sales pushing into a segment that had just become interesting — a renewal is a partner deciding on their own that the year was worth repeating.
A segment’s numbers describe the product you gave it, not the segment.
The write-off was numerically correct. Four in five accounts were leaving and 2% used the reporting, and nobody had misread anything. The figures were just being asked to answer a question they could not reach.
What I do differently since: when a number is used to justify not investing somewhere, I check what product was in place when it was taken. If the answer is “not much”, the number measures the absence rather than the opportunity, and the useful next move is a test scoped so that a bad result is still readable.
The reverse is the harder discipline. If I had scoped that MVP too small and it had failed, I would have handed the company a second bad number and made the write-off permanent — with better evidence behind it than the first one had. Arguing for a reframe means owning the cost of testing it badly.
The feature partners might have opened weekly did not ship
The named market view was the feature. Anonymized benchmarks are a commodity; the named version was what a partner might have opened weekly on its own merits. Privacy exposure ruled it out, correctly, so we shipped the weaker version.
The $50k-to-$350k move is real, but I can’t separate the product from the market around it. Enterprise growth stalled while this work was underway, giving the company a reason to care about a segment it had ignored, and Sales had reason to sell into it. I don’t know how much of the change belongs to either. The revenue figure should not settle that question.
And the reframe is the decision everything else here follows from, which makes it the one I would most like to be able to evidence. My record of it is the conclusion rather than the argument. The funnel map set the MVP scope and the twelve interviews set the four views, but what actually bought this segment four weeks of an engineer was at least as much enterprise stalling at the right moment as anything I put in front of anyone. A reframe that arrives while leadership is already hunting for a second engine is not the same thing as a reframe that changes their mind, and I can’t prove from my own notes which one this was.